Communicating Science about the Gold King Mine Spill and Water
Quality in the Animas River
Essential questions:
1. How have geological, biological and human factors created and exacerbated acid mine
drainage and water quality issues in the Animas River?
2. What ecological and human health threats might be associated with the Gold King Mine
spill: initially, currently and in the future?
3. What actions can be taken to improve the water quality in Cement Creek and the
Animas River watershed?
4.What is the role of science in making policy decisions?
Reflection:
To what degree do scientists have an obligation to communicate scientific concepts and data to
the public in an understandable manner?I believe that scientist that are experts in their fields are most definitely required to present clear data to the public. Scientist are trusted people and I think this must continue in order to have a trust filled relationship between the scientific community and the community in large. Some of the data that was produced for the Gold King Mine spill were difficult to interpret and comprehend. The graphs that were produced by the EPA (http://www.epa.gov/goldkingmine/epa-releases-additional-data-graphs-and-documents-stemming-gold-king-mine-incident) were simplified for the public viewing where as some of the graphs were much more complicated. When graphs have multiple lines and two vertical axises it is understandable that it is difficult to interpret exactly what the graph is stating about data. Also there is the question "How do we know what is true or not?". It simply makes people feel better when they know what is going on.
How has your understanding of scientific knowledge and/or the process of doing science
changed throughout the semester as you’ve examined and manipulated data collected by
professional scientists and performed analogous experiments to collect and analyze your own
data?
This semester I have learned that clarity and specificity are key to understanding and stating the facts about the science behind the Gold King Mine spill. The labs taught me a lot on how to write a successful lab and interpret data that my partner and I collected from said lab. Also, being able to understand data that was collected from the Animas River was really interesting. Being able to understand and then restate data that was complicated is a useful and necessary skill that can definitely be carried on and used in the future on all challenging pieces of data. At the beginning of the semester the lab writing and interpretation was difficult and as the semester progressed it became easier but still challenging at the same time.
Product:
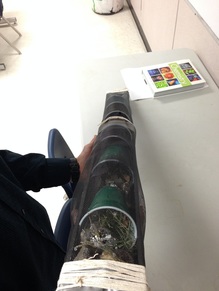
This product changes acidic water to neutral water using basic lime and rock filtration in an easy to carry user compatible tube.
Related project that I am proud of
Synthesis of oxide copper
https://docs.google.com/document/d/1KmbRWWZjeLBA9ftXwqSxaVgpDZnG032v0i0kvKlDVds/edit
Voices of The Animas River project interview
Animas Kitchen Project:
Crunchy Lasagna Poppers vs. Not so Crunchy Lasagna Poppers
Keegan Hickerson and Gabe Garcia
Steve Smith
Chemistry
Period 1
05/23/16
Abstract
Lasagna is arguably the best food on the planet. We decided to make a lasagna poppers because of the ethnic background in Gabe’s family and Keegan’s love for deep fried food. This recipe is a take on lasagna, and is an appetizer rather than a full meal. The meat and cheese and marinara sauce is wrapped in a lasagna noodle where it is battered and then fried. We measured the amount of air bubbles on a given line when cutting open the lasagna to measure the crunch of each of the poppers.
We believed that the more air pockets on the surface of the crust on a lasagna popper will make the popper crunchier. We executed this by adding more breading and less breading to see the difference in texture.
The more breading was as expected, more crunchy. The less breading did have significantly less crunch and was more doughy due to the large amount of noodle used in the dish. This experiment was a succesful with the participating taste testers as well as in the quantitative results.
Introduction:
The purpose of conducting our experiment with lasagna poppers is to find out if more bubbles per square centimeter will cause crunchier textures. Our anticipated hypothesis was that the more breading used, the crunchier the lasagna popper would turn out. We are looking for the perfect balance between crunchy and moist texture. We believe that the more bubbles per square centimeter, due to more air and less breading, will mean crunchier outer shell. The denser the material means, in this case, more moisture making a softer texture. Lasagna Poppers Originated in Greece when the Romans overthrew the government and occupied the country in 146 BC. They went started adopting culture, language, and foods as their own. The Greek word laganon is thought to be the origin of lasagna used to describe strips of flat dough [1]. Lasagna is usually in a tray with different layers of cheese, meat, and noodles. Ours has all of those components but fryed and more of an appetizer rather than a meal. Frying food always makes things better so, in conclusion lasagna poppers are better.
Methods:
This experiment has hazards that could possibly result in burning of skin and eyes. The recipe deals with oil and boiling water, both of which can be harmful.
- 1 tbsp. garlic - minced
- 1/2 cup onion - chopped
- 1 lb. ground beef
- 1 1/2 cup marinara sauce
- 8 oz shredded mozzarella cheese
- salt & pepper - to taste
- 1 1/2 cup flour
- 2 cups panko bread crumbs
- 4 eggs
- 8 to 10 lasagna noodles - depending on amount of filling in each
- 3 to 4 cups of canola oil for frying - depending on size of pot used- at a heat of 375º F.
Coat a 10 inch frying pan with 25 mL of oil olive oil. Add the 1 tbsp. of minced garlic and ½ of a chopped onion, stirring constantly until lightly browned. Add the 1 lb. of ground beef, stir to mix with onion and garlic. Once beef has begun to brown and water has been released drain water and fat then continue cooking until beef begins to brown and become tender and crispy. Add 1 ½ cups of marinara sauce and mix together. Sprinkle 1 teaspoon salt and 1 teaspoon pepper to taste, remove heat, and add 8 oz mozzarella. Stir until Mozzarella binds to mixture.
While mixture cools boil 4 cups of water in medium pot and add 8-10 lasagna noodles, lay them in across each other in a star formation so they do not bind together, stir regularly. After 8 to 10 minutes drain pasta and allow to cool for 5 minutes. Cut noodles down to 3-4 inch slices and place mixture inside and roll. Place poppers in freezer for 12 minutes.
Dip poppers in egg wash, flour, breadcrumbs then once more in the egg wash and breadcrumbs. Freeze for additional 12 minutes.
Heat 3-4 inches of canola oil at medium heat in a pot for 15 minutes. Test by splashing drops of water into oil, it should sizzle. Place poppers in oil 3 or 4 at a time until they are golden brown on all sides, allow them to cool for 10-12 minutes and enjoy with marinara sauce for your dipping pleasure.
To determine the crunchiness and taste, taste tests will have to be conducted and recorded. To find the quantitative data, measure the bubbles per centimeter on the lasagna popper as stated below.
Measure bubbles per centimeter by putting a paper rectangle (8 cm by 4 cm) over the lasagna popper and count the amount of bubbles in a diagonal line (from one corner to the opposite lower/higher opposite corner. The amount of bubbles will then be divided by 32 which is 8 and 4 multiplied together. After dividing the amount of found bubbles by 32 you will find the amount of bubbles in that area approximately.
Discussion:
This experiment was looking at the crunchiness of lasagna poppers. We expected that the more batter used to make the lasagna popper would result in softer, less crunchy, texture and the more air bubbles with less batter would make a crunchier surface.
During the experiment we collected the amount of air bubbles by using the method of putting an 8 centimeter by 4 centimeter rectangle on top of our lasagna popper and counted the amount of bubbles that go across a diagonal line across the rectangle. This sets up the experiment before the subjects consume the lasagna popper so you know which popper should be crunchier on account of the amount of bubbles in the rectangle.
We then collected qualitative data that was formed as taste tests. This gave us an average of which poppers people prefered (crunchier or less crunchy).
Our dependent variable, air bubbles per centimeter, was influenced by our independent variable which was the amount of breading put on the lasagna popper. The amount of breading on our lasagna popper, after being cooked, browns and moisture leaves the bread making the bread puffen and harden. The moisture is majorly reduced leaving pockets of air.
Significance of results for food science and the recipe are clearly stated and explained. Initial expectations are evaluated against results and within the uncertainty of experimental Errors and uncertainty in the experiment are described and their potential impact on results is discussed Improvements to investigation and logical next investigations are described
Biography:
1. http://www.pagliacci.com/blog/news/post/a-brief-history-of-lasagna
2. https://mybravoblog.wordpress.com/2015/07/22/the-history-of-lasagna/
3.http://www.jamieoliver.com/bloggers/viewtopic.php?id=79027#BmUVwwUKeddAjA6A
Results:
Qualitative Taste Test
Table 1: Sample 1: This table shows the qualitative taste test of sample 1 which only had one layer of breadcrumbs. The testers tested taste and crunch on each of lasagna poppers.
Trials
Crunchiest
Tastes
Tester 1
5
4
Tester 2
1
1
Tester 3
5
10
Tester 4
6
3
Tester 5
3
8
Tester 6
6
7
Tester 7
5
4
Tester 8
5
10
Tester 9
6
10
Tester 10
5
10
Average
4.83
8.16
Chart 1: Sample 1
This chart shows all of the results from the taste test.
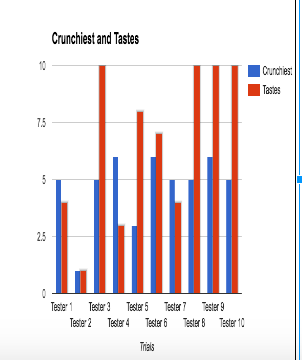
Table 2: Sample 2
This table shows the qualitative taste test of sample 2 which had 2 layers of breadcrumbs. The testers recorded taste and crunch on each of lasagna poppers.
Trials
Crunchiest
Tastes
Tester 1
6
7
Tester 2
1
1
Tester 3
7
7
Tester 4
7
5
Tester 5
8
4
Tester 6
5
9
Tester 7
6
8
Tester 8
5
10
Tester 9
6
10
Tester 10
5
10
Average
5.6
7.1
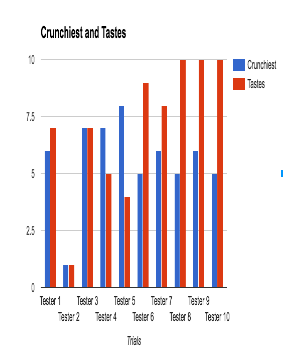
Chart 2: Sample 2
This chart shows all of the different results from the taste test.
This table shows the qualitative taste test of sample 2 which had 2 layers of breadcrumbs. The testers recorded taste and crunch on each of lasagna poppers.
Trials
Crunchiest
Tastes
Tester 1
6
7
Tester 2
1
1
Tester 3
7
7
Tester 4
7
5
Tester 5
8
4
Tester 6
5
9
Tester 7
6
8
Tester 8
5
10
Tester 9
6
10
Tester 10
5
10
Average
5.6
7.1
Chart 2: Sample 2
This chart shows all of the different results from the taste test.
Quantitative Test
Table 3: Sample 1 (8x4 cm rectangle)
Trials
Air Bubbles/cm
Trial 1
5
Trial 2
8
Average
6.5
Chart 3: Sample 1
This chart shows the two trials of sample 1 and the amount of air bubbles on the line.
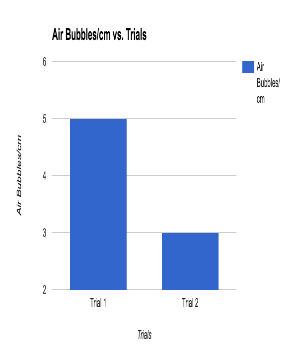
Table 4: Sample 2
(8x 4 cm rectangle)
This table gives the data for the air bubbles on the line.
Trials
Air Bubbles/cm
Trial 1
8
Trial 2
6
Average
7
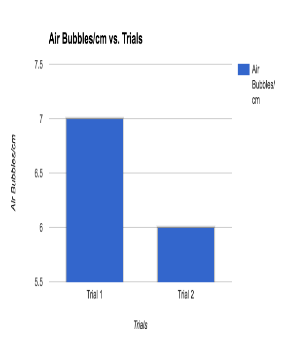
Chart 4: Sample 2
This chart shows the two trials of sample 2 and the amount of air bubbles on the line.